Brown’s Food & CO Airtable Process Tracking System .
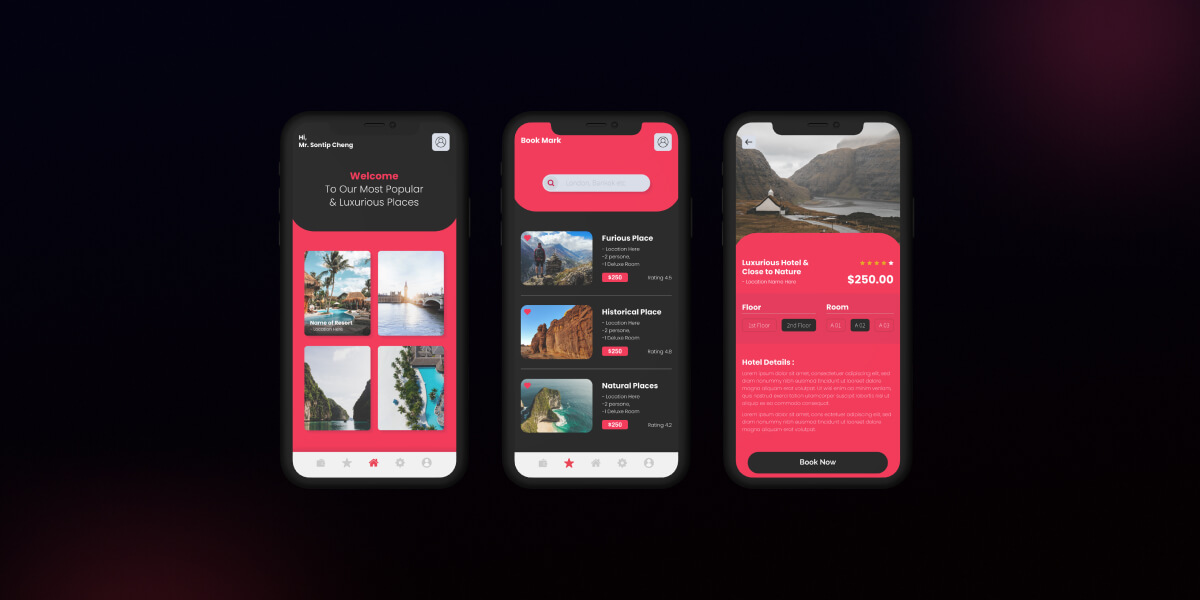
Through a wide variety of mobile applications, we’ve developed a unique visual system and strategy that can be applied across the spectrum of available applications.
Short description: A custom Airtable system that turned scattered, manual milk pooling records into a structured, automated shift-based process.
Full body: Brown’s Food & Co needed to track milk pooling across shifts without relying on manual spreadsheet updates that were easy to get wrong and hard to audit. This engagement built a shift-based Airtable system with JavaScript automation to handle the process end-to-end — structured records, automated calculations, and a system the team can maintain without needing a developer on call.
It’s a good illustration of what “data consulting” looks like at the small-business scale: not a flashy AI model, but the unglamorous, high-impact work of turning operational chaos into something reliable.
Through a wide variety of mobile applications, we’ve developed a unique visual system and strategy that can be applied across the spectrum of available applications.
Short description: An interactive dashboard for exploring Rwanda’s hydrological gauge network — built to make a dense dataset visually explorable for the flood forecasting team.
Full body: Behind any flood forecasting model sits a network of physical gauges collecting river discharge data — and understanding what that network actually looks like, where gauges are, and what data they’re producing, is harder than it should be from raw spreadsheets. I built an interactive HTML gauge explorer dashboard as a supporting tool for the Rwanda Flood Forecasting project, giving the team a visual, explorable interface into Rwanda’s hydrological monitoring network.
It’s a smaller build than the core forecasting model, but the kind of tool that makes a large technical project usable day-to-day by people who aren’t going to read raw CSVs.